Dan Szymborski, FanGraphs,
October 12, 2018:
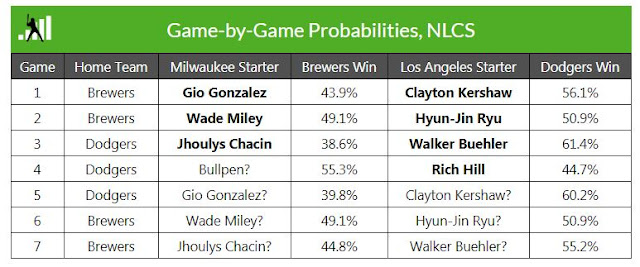
The ZiPS projection system will update these charts after every game and as the starting pitcher probables change. They are based on the up-to-date ZiPS projections of the strengths of the teams and the projected starting pitchers. They are different than the playoff odds that appear elsewhere at this site. The FanGraphs playoff probabilities are based on 10,000 simulations using the updated projections in the depth charts. Where ZiPS differs is guessing the game-by-game starting pitcher matchups and using the ZiPS projections, including split projections.
First, here are the game-by-game probabilities:
And here are the overall series probabilities.


2 comments:
So the bottom line, judging by the data, is that the Astros and Red Sox are pretty evenly matched, so it's anybody's series to win.
It looks not to be the case in the NL, with the Dodgers being given a 60% chance of winning their championship series over the Brew Crew.
Super interesting in the NL game by game that the Brewers highest win probability is a bullpen game (Game 4).
Post a Comment